こんにちは。現役エンジニアの”はやぶさ”@Cpp_Learningです。
仕事でもプライベートでも機械学習で色々やってます。今回は教師なし学習のStar Clustering(クラスタリング手法) を紹介します。
Contents
クラスタリングとは
クラスタリングについては、以下のスライドがとても勉強になります。
https://www.slideshare.net/SeiichiUchida/22-77834256
本サイトで公開している距離学習の記事を読めば「距離」・「空間」・「クラスタリング容易なデータセット」についても学ぶことができます。
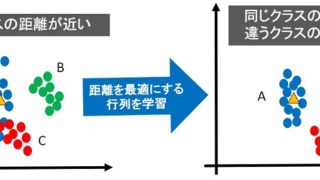
上記スライドや記事を読んでから、以降を読むのがオススメです。
k-means法によるクラスタリング
文部科学省が素敵な資料を公開し、SNSで話題になりました(下記参照)。
この資料で「k-means法によるクラスタリング」を紹介しています。k-means法ではクラスタ数をあらかじめ決める必要があります(下図 手順1)。
クラスタ数をあらかじめ把握している場合は良いのですが、教師なし学習を選択する理由として…
などが考えられます。要するに「最適なクラスタ数が不明なので、まずは教師なし学習で確認」というケースが多いと感じています。
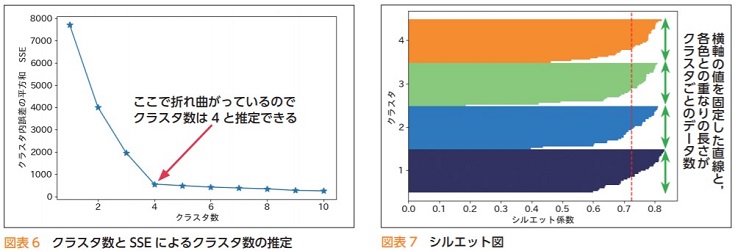
エルボー法とシルエット分析 -最適なクラスタ数を算出-
k-means法の最適なクラスタ数を把握する手法として「エルボー法」と「シルエット分析」があります。
そのため以下のフローでクラスタリングすることが多いです。
- 「エルボー法」などでクラスタ数を算出
- k-means法でクラスタリング
上記の手順をどう思うかは人それぞれですが…
と感じた フクロウの”くるる”@kururu_owl のために Star Clustering を紹介します。
Star Clusteringとは
Star Clustering の概要は以下の通りです。
The Star Clustering algorithm is a clustering technique that is loosely inspired and analogous to the process of star system formation. Its purpose is as an alternative clustering algorithm that does not require knowing the number of clusters in advance or any hyperparameter tuning.
翻訳サービスの DeepL を使って日本語にしたものが以下です。
Star Clustering アルゴリズムは、星系形成のプロセスに類似したクラスタリング手法です。その目的は、クラスタ数を事前に知る必要がなく、ハイパーパラメータの調整も必要としない代替クラスタリングアルゴリズムです。
Star Clustering アルゴリズム素敵!そして名前がカッコイイ☆★☆彡
実践!Star Clusteringによるクラスタリング
Star Clusteringによるクラスタリングを実践してみます。plot_cluster_iris.py を参考にirisデータセットをクラスタリングするソースコードを作成します。
import
最初はimportから
|
1 2 3 4 5 6 |
import numpy as np import matplotlib.pyplot as plt from mpl_toolkits.mplot3d import Axes3D from sklearn.cluster import KMeans from sklearn import datasets # from star_clustering import StarCluster |
最後の行をコメントアウトしているのは、本記事のコードをGoogle Colaboratoryに写経すれば簡単に実践できる形に修正したためです。
Star Clusteringアルゴリズム
Star Clusteringを実現する2つの処理(モジュール)を実装します。
まずは距離を算出する処理(distances.pyのコピペ)
|
1 2 3 4 5 6 7 8 9 10 11 12 13 14 15 16 17 18 19 20 21 22 23 24 25 26 27 28 29 30 31 32 33 34 35 36 37 38 39 40 41 42 43 44 45 46 47 |
# import numpy as np ''' classes for creating a matrix of the distances between all members of a set of vectors ''' class Angular(object): @staticmethod def calc(vectors, center_cols=True, center_rows=True): n = vectors.shape[0] target = np.zeros((n, n), dtype='float32') if center_cols: vectors = vectors - np.expand_dims(np.average(vectors, axis=0), axis=0) if center_rows: vectors = vectors - np.expand_dims(np.average(vectors, axis=-1), axis=-1) # vector norms remain the same each loop iteration so only have to be calculated once norms = np.linalg.norm(vectors, axis=-1) # loop calculates cosine similarity between 1 vector and all vectors each iteration for i in range(n): target[i] = (vectors.dot(vectors[i])) / (norms[i] * norms) # convert cosine similarities to angular distance target = np.arccos(target) / np.pi return target class Euclidean(object): @staticmethod def calc(vectors, center_cols=False, center_rows=False): n = vectors.shape[0] d = vectors.shape[1] target = np.zeros((n, n, d), dtype='float32') if center_cols: vectors = vectors - np.expand_dims(np.average(vectors, axis=0), axis=0) if center_rows: vectors = vectors - np.expand_dims(np.average(vectors, axis=-1), axis=-1) for i in range(n): for j in range(n): target[i, j] = vectors[i] - vectors[j] target = np.linalg.norm(target, axis=-1) return target |
続いてStar Clusteringアルゴリズム(star_clustering.pyのコピペ)
|
1 2 3 4 5 6 7 8 9 10 11 12 13 14 15 16 17 18 19 20 21 22 23 24 25 26 27 28 29 30 31 32 33 34 35 36 37 38 39 40 41 42 43 44 45 46 47 48 49 50 51 52 53 54 55 56 57 58 59 60 61 62 63 64 65 66 67 68 69 70 71 72 73 74 75 76 77 78 79 80 81 82 83 84 85 86 87 88 89 90 91 92 93 94 95 96 97 98 99 100 101 102 103 104 105 106 107 108 109 110 111 112 113 114 115 116 117 118 119 120 121 122 123 124 125 126 127 128 129 130 131 132 |
# Copyright 2020 Joseph Lin Chu # # Licensed under the Apache License, Version 2.0 (the "License"); # you may not use this file except in compliance with the License. # You may obtain a copy of the License at # # http://www.apache.org/licenses/LICENSE-2.0 # # Unless required by applicable law or agreed to in writing, software # distributed under the License is distributed on an "AS IS" BASIS, # WITHOUT WARRANTIES OR CONDITIONS OF ANY KIND, either express or implied. # See the License for the specific language governing permissions and # limitations under the License. # import numpy as np # from distances import Angular, Euclidean class StarCluster(object): """Star Clustering Algorithm""" def fit(self, X, upper=False, limit_exp=1, dis_type='euclidean'): # Set Constant of Proportionality golden_ratio = ((1.0 + (5.0 ** 0.5)) / 2.0) # Number of Nodes n = X.shape[0] # Number of Features d = X.shape[1] if dis_type == 'angular': dis_class = Angular else: dis_class = Euclidean # Construct Node-To-Node Matrix of Distances distances_matrix = dis_class.calc(X) # Determine Average Distance And Extend By Constant of Proportionality To Set Limit limit = np.sum(distances_matrix) / (n * n - n) * golden_ratio ** limit_exp # Construct List of Distances Less Than Limit distances_list = [] for i in range(n): for j in range(n): if i < j: distances_list.append((i, j, distances_matrix[i, j])) # Sort List of Distances From Shortest To Longest distances_list.sort(key=lambda x: x[2]) # Build Matrix of Connections Starting With Closest Pairs Until Average Mass Exceeds Limit empty_clusters = [] mindex = 0 self.labels_ = np.zeros(n, dtype='int32') - 1 if upper: self.ulabels = np.zeros(n, dtype='int32') mass = np.zeros(n, dtype='float32') while np.mean(mass) <= limit: i, j, distance = distances_list[mindex] mass[i] += distance mass[j] += distance if self.labels_[i] == -1 and self.labels_[j] == -1: if not empty_clusters: empty_clusters = [np.max(self.labels_) + 1] empty_clusters.sort() cluster = empty_clusters.pop(0) self.labels_[i] = cluster self.labels_[j] = cluster elif self.labels_[i] == -1: self.labels_[i] = self.labels_[j] elif self.labels_[j] == -1: self.labels_[j] = self.labels_[i] elif self.labels_[i] < self.labels_[j]: empty_clusters.append(self.labels_[j]) self.labels_[np.argwhere(self.labels_ == self.labels_[j])] = self.labels_[i] elif self.labels_[j] < self.labels_[i]: empty_clusters.append(self.labels_[i]) self.labels_[np.argwhere(self.labels_ == self.labels_[i])] = self.labels_[j] mindex += 1 distances_matrix[distances_matrix == 0.0] = np.inf # Reduce Mass of Each Node By Effectively Twice The Distance To Nearest Neighbour for i in range(n): mindex = np.argmin(distances_matrix[i]) distance = distances_matrix[i, mindex] mass[i] -= distance mass[mindex] -= distance # Set Threshold Based On Average Modified By Deviation Reduced By Constant of Proportionality threshold = np.mean(mass) - np.std(mass) / golden_ratio # Disconnect Lower Mass Nodes for i in range(n): if mass[i] <= threshold: self.labels_[i] = -1 if upper: uthreshold = np.mean(mass) + np.std(mass) / golden_ratio for i in range(n): if mass[i] >= uthreshold: self.ulabels[i] = -1 # Ignore Masses of Nodes In Clusters Now mass[self.labels_ != -1] = -np.inf acount = 0 # Go Through Disconnected Nodes From Highest To Lowest Mass And Reconnect To Nearest Neighbour That Hasn't Already Connected To It Earlier while -1 in self.labels_: i = np.argmax(mass) mindex = i if upper: while self.labels_[mindex] == -1: dsorted = np.argsort(distances_matrix[i]) not_connected = True sidx = 0 while not_connected: cidx = dsorted[sidx] if self.ulabels[cidx] == -1: acount += 1 sidx += 1 else: mindex = cidx not_connected = False distances_matrix[i, mindex] = np.inf else: while self.labels_[mindex] == -1: mindex = np.argmin(distances_matrix[i]) distance = distances_matrix[i, mindex] distances_matrix[i, mindex] = np.inf self.labels_[i] = self.labels_[mindex] mass[i] = -np.inf if upper: print('Connections to nodes above upper mass threshold skipped: {}'.format(acount)) return self def predict(self, X): self.fit(X) return self.labels_ |
irisデータセットをダウンロード
irisデータセットをダウンロードし、説明変数をX、目的変数をyにセットします。
|
1 2 3 |
iris = datasets.load_iris() X = iris.data y = iris.target |
可視化
適当な2つの説明変数を選択してデータを可視化します。
|
1 2 3 4 5 |
plt.scatter(X[:, 0], X[:, 2], s=40, c=y, edgecolor='k') plt.xlabel('Sepal length') plt.ylabel('Petal length') plt.grid(True) plt.show() |
 3つの説明変数を選択して3Dでも可視化します。
|
1 2 3 4 5 6 7 8 9 10 11 12 13 14 15 16 17 18 19 20 21 22 23 24 25 26 27 28 29 30 31 |
# グラフ全体の設定 fig = plt.figure() ax = Axes3D(fig, rect=[0, 0, .95, 1], elev=48, azim=134) # ラベルとカテゴリ変数 names = [('Setosa', 0), ('Versicolour', 1), ('Virginica', 2)] # 描画設定 for name, label in names: ax.text3D(X[y == label, 3].mean(), X[y == label, 0].mean(), X[y == label, 2].mean() + 2, name, horizontalalignment='center', bbox=dict(alpha=.2, edgecolor='w', facecolor='w')) # 軸設定 ax.w_xaxis.set_ticklabels([]) ax.w_yaxis.set_ticklabels([]) ax.w_zaxis.set_ticklabels([]) ax.set_xlabel('Petal width') ax.set_ylabel('Sepal length') ax.set_zlabel('Petal length') # タイトル設定 ax.set_title('Ground Truth') ax.dist = 12 # 描画 ax.scatter(X[:, 3], X[:, 0], X[:, 2], s=40, c=y, edgecolor='k') plt.show() |
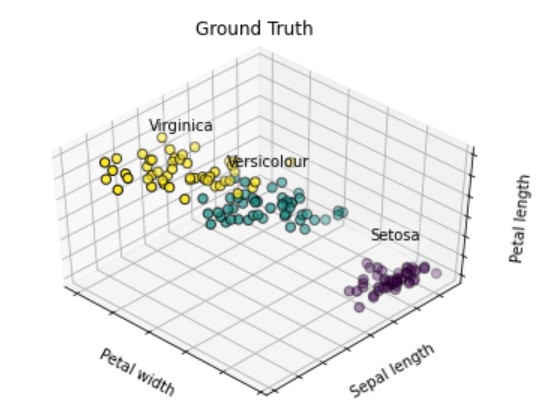
ラベルに応じて、3色のプロットを使いました。
データセットを可視化したときに『緑プロットと黄プロットの距離が近いので、クラスタリング困難なデータセットだな』というのをパッと考察できると良いですね。
Star Clusteringによるクラスタリング
fit含め、わずか2行でStar Clusteringによるクラスタリングを実現できます。
|
1 2 3 4 |
model = StarCluster() model.fit(X) |
scikit-learn同様の使い易さです。
クラスタリング結果確認
クラスタリング結果を確認する方法は以下の2パターンがあります。
|
1 2 3 4 5 6 7 |
# Used labels_ labels = model.labels_ print("labels:", labels) # Used predict(train_data) y_pred = model.predict(X) print("y_pred:", y_pred) |
今回のクラスタリング結果は以下の通りでした。
labels: [1 1 1 1 1 1 1 1 1 1 1 1 1 1 1 1 1 1 1 1 1 1 1 1 1 1 1 1 1 1 1 1 1 1 1 1 1 1 1 1 1 1 1 1 1 1 1 1 1 1 0 0 0 0 0 0 0 0 0 0 0 0 0 0 0 0 0 0 0 0 0 0 0 0 0 0 0 0 0 0 0 0 0 0 0 0 0 0 0 0 0 0 0 0 0 0 0 0 0 0 0 0 0 0 0 0 0 0 0 0 0 0 0 0 0 0 0 0 0 0 0 0 0 0 0 0 0 0 0 0 0 0 0 0 0 0 0 0 0 0 0 0 0 0 0 0 0 0 0 0]
y_pred: [1 1 1 1 1 1 1 1 1 1 1 1 1 1 1 1 1 1 1 1 1 1 1 1 1 1 1 1 1 1 1 1 1 1 1 1 1 1 1 1 1 1 1 1 1 1 1 1 1 1 0 0 0 0 0 0 0 0 0 0 0 0 0 0 0 0 0 0 0 0 0 0 0 0 0 0 0 0 0 0 0 0 0 0 0 0 0 0 0 0 0 0 0 0 0 0 0 0 0 0 0 0 0 0 0 0 0 0 0 0 0 0 0 0 0 0 0 0 0 0 0 0 0 0 0 0 0 0 0 0 0 0 0 0 0 0 0 0 0 0 0 0 0 0 0 0 0 0 0 0]
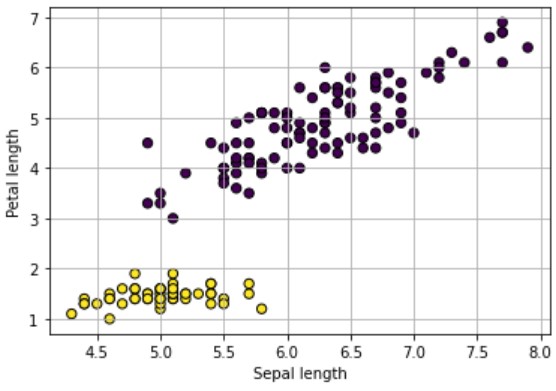
クラスタ数:2(各データに”0″と”1″のラベル付け)という結果でした。
クラスタリング結果の可視化
クラスタリング結果を2Dで可視化します。
|
1 2 3 4 5 |
plt.scatter(X[:, 0], X[:, 2], s=40, c=y_pred, edgecolor='k') plt.xlabel('Sepal length') plt.ylabel('Petal length') plt.grid(True) plt.show() |
 続いて3Dでも可視化します。
|
1 2 3 4 5 6 7 8 9 10 11 12 13 14 15 16 17 18 19 20 21 22 23 24 25 26 27 28 29 30 31 |
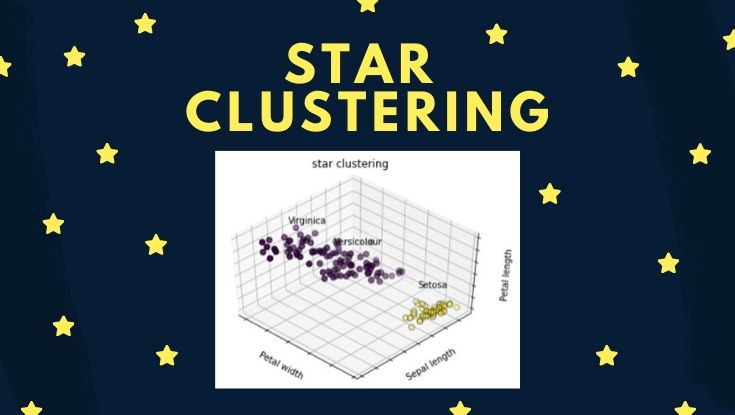
# グラフ全体の設定 fig = plt.figure() ax = Axes3D(fig, rect=[0, 0, .95, 1], elev=48, azim=134) # ラベルとカテゴリ変数 names = [('Setosa', 0), ('Versicolour', 1), ('Virginica', 2)] # 描画設定 for name, label in names: ax.text3D(X[y == label, 3].mean(), X[y == label, 0].mean(), X[y == label, 2].mean() + 2, name, horizontalalignment='center', bbox=dict(alpha=.2, edgecolor='w', facecolor='w')) # 軸設定 ax.w_xaxis.set_ticklabels([]) ax.w_yaxis.set_ticklabels([]) ax.w_zaxis.set_ticklabels([]) ax.set_xlabel('Petal width') ax.set_ylabel('Sepal length') ax.set_zlabel('Petal length') # タイトル設定 ax.set_title('star clustering') ax.dist = 12 # 描画 ax.scatter(X[:, 3], X[:, 0], X[:, 2], s=40, c=y_pred, edgecolor='k') plt.show() |
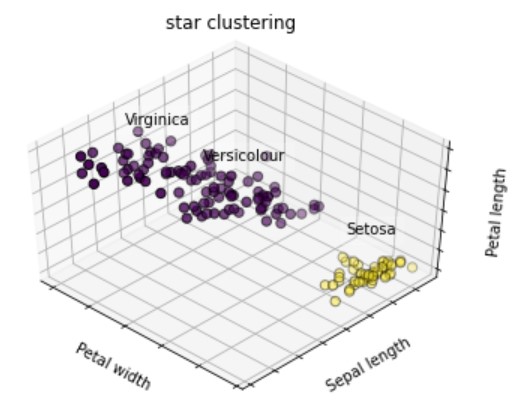 クラスタ数をあらかじめ設定しなくても、クラスタリングできるので、とても使い易いですね。
と感じた人がいると思いますが『3分類が困難なデータセットだった』という考え方もできます。
と考え「情報不足なので情報量(説明変数)を増やしてみる」・「データ加工(特徴量エンジニアリング)を試す」など、次に実践したいことに繋げられれば良いと感じています。
まとめ
クラスタリングやk-means法について簡単に説明し、クラスタ数を自動推定してくれるStar Clustering を紹介しました。
また以下のような疑問に対する考え方(マインド)についても簡単に紹介しました。
- どんなときにクラスタリングをするのか?
- クラスタリング結果をどう考察するのか?
- 考察した後、次に何をすれば良いか?
機械学習の勉強をしていると、どうしても精度の良い悪いに注目しがちですが「なぜ精度の良い分類が困難なのか?」を考え、次に活かすことが重要だと考えています。
本記事が参考になれば嬉しいです。
最後に因果推論の道具として機械学習を使いたい人にオススメの本を紹介します。

