こんにちは。現役エンジニアの”はやぶさ”@Cpp_Learningです。
今回は説明性・解釈性を考慮した機械学習による異常検知について紹介します。
Contents
機械学習モデルの説明性・解釈性とは
モデルの説明性・解釈性については、以下の記事で説明済みなので割愛します。

本記事では Isolation Forest による異常検知について紹介します。
Isolation Forestとは
Isolation Forest は Random Forest と同様、ランダムに生成される複数の決定木(森)から異常値を推測するアルゴリズムです。
- ランダムに2つの特徴量を選択
- 各特徴量の最小値~最大値の範囲でランダムな値を選定し、データを分割
- 全データが孤立するまで❷を繰り返しながら、決定木を作成
- 分岐の早い段階で孤立したデータを異常と判定
このアルゴリズムの図解が下図です。決定木を生成し、分岐の早い段階で孤立した赤データを外れ値(≒異常値)として検知します。
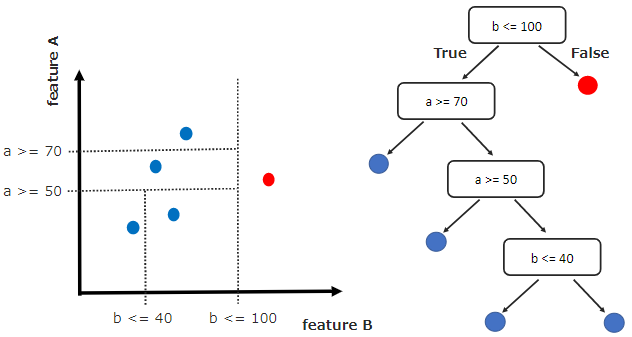
上図では1つの決定木しか生成していませんが、実際には大量の決定木を生成して、異常検知を実現します。
実践!Isolation Forestによる異常検知
sklearn.ensemble モジュールが Isolation Forest もサポートしています。なので、skleanユーザーであれば、比較的簡単に Isolation Forestによる異常検知を試すことができます。
問題設定
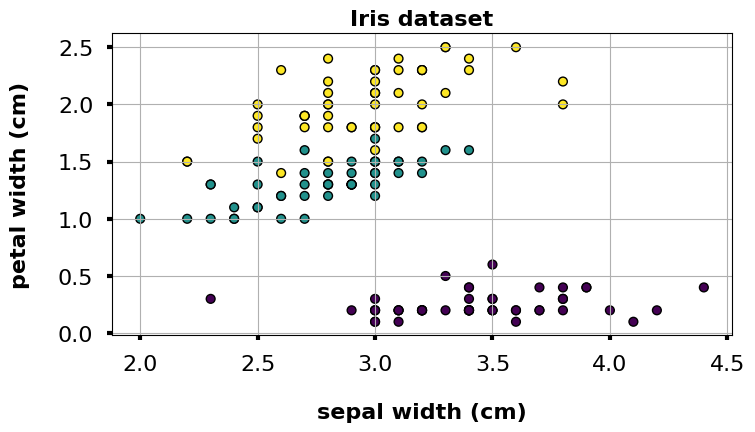
今回は機械学習チュートリアルでお馴染みの irisデータセットに対し、分類ではなく異常検知を実践します。以降からソースコードを書いてきます。
本記事のソースコードはGoogle Colaboratoryで動作確認しました(2021/01/15)
Import
まずはimportから
|
1 2 3 4 5 6 |
from matplotlib import pyplot as plt import plotly.express as px from sklearn.datasets import load_iris from sklearn.ensemble import IsolationForest from sklearn.tree import plot_tree |
データセット
irisデータセットをデータフレーム形式で読込みます。
|
1 2 3 4 5 |
iris = load_iris(as_frame=True) X, y = iris.data, iris.target df = iris.frame # df.head() |
データ可視化
サクッとデータを可視化できるように散布図作成用の関数を作っておきます。
|
1 2 3 4 5 6 7 8 9 10 11 12 13 14 15 16 17 18 19 20 21 22 23 24 25 26 27 28 |
def my_plot(df, x="sepal length (cm)", y="sepal width (cm)", s=40, c=y, edgecolor='k', title="Iris dataset"): '''散布図の描画''' # 図のサイズ設定 fig = plt.figure(figsize=(8,4), dpi=100) ax = fig.add_subplot(1,1,1) # プロット設定 ax.scatter(df[x], df[y], s=s, c=c, edgecolor=edgecolor) # 目盛りの文字サイズ設定 ax.xaxis.set_tick_params(direction="out", labelsize=16, width=3, pad=10) ax.yaxis.set_tick_params(direction="out", labelsize=16, width=3, pad=10) # 軸のラベル設定 ax.set_xlabel(x, fontsize=16, labelpad=20, weight='bold') ax.set_ylabel(y, fontsize=16, labelpad=20, weight='bold') # グラフのタイトル ax.set_title(title, fontsize=16, fontweight=16, weight='bold') # グリッド設定 ax.grid(True); # データ可視化 my_plot(df, x="sepal width (cm)", y="petal width (cm)", s=40, c=y, edgecolor="k", title="Iris dataset") |
Isolation Forestの学習
Isolation Forestの各パラメータをセットして学習します。
|
1 2 3 4 5 6 7 8 9 10 11 |
model = IsolationForest( n_estimators=100, max_samples='auto', contamination=0.05, max_features=4, bootstrap=False, n_jobs=-1, random_state=1 ) model.fit(X) |
n_estimators=100 なので、100個の決定木を生成します
推論 -異常検知とスコア算出-
以下のコードで推論…つまりはデータセット内の異常データを検知します。
|
1 2 3 |
# predict and calculate scores df["anomaly_label"] = model.predict(X) df['scores'] = model.decision_function(X) |
異常と判定されたデータのみを抽出し、表で確認してみます。
|
1 2 3 |
# 異常データのみ抽出 anomaly_df = df[df.anomaly_label==-1] anomaly_df |
| index | sepal length (cm) | sepal width (cm) | petal length (cm) | petal width (cm) | target | anomaly_label | scores |
|---|---|---|---|---|---|---|---|
| 13 | 4.3 | 3.0 | 1.1 | 0.1 | 0 | -1 | -0.039104 |
| 15 | 5.7 | 4.4 | 1.5 | 0.4 | 0 | -1 | -0.003895 |
| 41 | 4.5 | 2.3 | 1.3 | 0.3 | 0 | -1 | -0.038639 |
| 60 | 5.0 | 2.0 | 3.5 | 1.0 | 1 | -1 | -0.008813 |
| 109 | 7.2 | 3.6 | 6.1 | 2.5 | 2 | -1 | -0.037663 |
| 117 | 7.7 | 3.8 | 6.7 | 2.2 | 2 | -1 | -0.046873 |
| 118 | 7.7 | 2.6 | 6.9 | 2.3 | 2 | -1 | -0.055233 |
| 131 | 7.9 | 3.8 | 6.4 | 2.0 | 2 | -1 | -0.064742 |
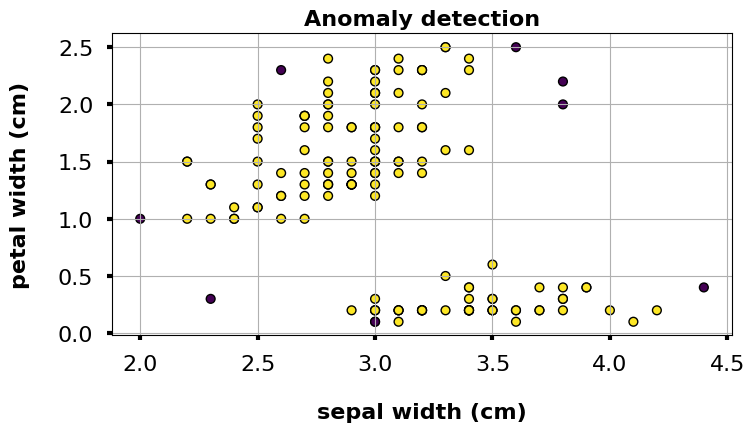
「anomaly_label == -1 が異常、anomaly_label == 1 が正常」と判定されたデータです。 scoresの詳細は割愛しますが、スコアが低いほど異常なことを表現しており、スコアが負の場合は外れ値となります。今回は計8つの異常データが検知されました。
異常検知の説明性・解釈性
表だけでなく、散布図で異常を可視化します。
|
1 2 3 |
# 異常値の可視化 my_plot(df, x="sepal width (cm)", y="petal width (cm)", s=40, c=df["anomaly_label"], edgecolor="k", title="Anomaly detection") |
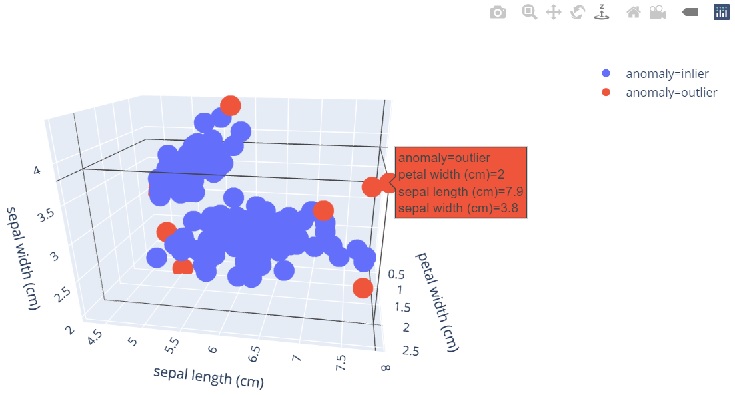
3Dで可視化するなら、plotlyでグリグリ動かせるグラフを作成するのがオススメです。
|
1 2 3 4 5 6 7 8 9 10 11 12 13 14 |
# df['anomaly'] = 'outlier' or 'inlier' df['anomaly'] = df['anomaly_label'].apply(lambda x: 'outlier' if x==-1 else 'inlier') # 3Dで可視化 fig = px.scatter_3d( df, x='petal width (cm)', y='sepal length (cm)', z='sepal width (cm)', color='anomaly' # color="anomaly_label" ) fig.show() |
決定木の構造を可視化することで、どんな根拠で異常検知したのか確認できます。
|
1 2 3 4 5 6 7 8 9 10 11 12 13 14 15 16 17 18 19 20 21 |
# 決定木リスト(0~99まである)の一番上を選択 estimator = model.estimators_[0] # 図のサイズ設定 plt.figure(figsize=(30, 8)) # plt.figure(figsize=(30, 8), dpi=100) # 決定木の可視化 plot_tree( estimator, max_depth=3, feature_names = iris['feature_names'], # proportion=True, filled=True, rounded=True, precision=2, fontsize=12, ) # 決定木の構造図を保存 plt.savefig("tree.png") |

上図の色が濃いのが samples=1 です。つまり以下の早い段階の分岐で孤立し、異常と判定されたデータです。
- petal length (cm) <= 1.24 で True
- sepal length (cm) <= 4.49 で True
異常データのみを抽出した表の内、最初の行のみを改めて確認してみると、上記の分岐で異常と判定されたデータだと分かります。
| index | sepal length (cm) | sepal width (cm) | petal length (cm) | petal width (cm) | target | anomaly_label | scores |
|---|---|---|---|---|---|---|---|
| 13 | 4.3 | 3.0 | 1.1 | 0.1 | 0 | -1 | -0.039104 |
他の異常データについても決定木の構造を可視化することで、根拠を確認できます。
以上が Isolation Forest による説明性・解釈性を考慮した異常検知の実践でした。
まとめ
Isolation Forestのアルゴリズム概要から、説明性・解釈性を考慮した異常検知の実践までをソースコード付きで紹介しました。
などと悩んでいるフクロウや人にとって、本記事が参考になれば嬉しく思います。
以下 本の紹介


