こんにちは。現役エンジニアの”はやぶさ”@Cpp_Learningです。Pythonでデータ分析して、業務改善に繋げる活動などをしています。
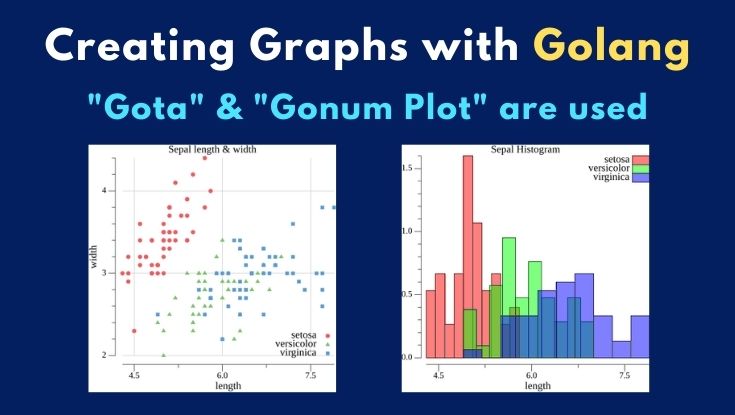
本記事ではPythonではなくGo言語によるデータ可視化について紹介します。
本記事を最後まで読めば、Goで上図のようなグラフ作成ができるようになります
Contents
Goでデータ可視化(グラフ作成)するモチベーション
はじめにPythonではなくGoを使う理由を説明します。
Pythonを使うメリット
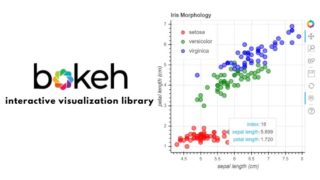
Pythonにはデータ分析に活用できる優秀なライブラリが数多く存在します。例えば、matplotlib , seaborn , Bokeh , Plotly などを活用すれば、手軽に多様なグラフを作成できます。
本サイトでも、データ可視化に関する記事をいくつか公開しています。
Goを使うメリット
Pythonだと書くのは簡単ですが、パフォーマンスが思ったほど出なかったり、実行環境のないPCに対し、手軽にアプリを配布できないなどの課題があります。
以下の要求を満すアプリケーションを開発したいなら、Pythonで頑張るより、コンパイラで最適化しつつ、バイナリファイルを手軽に生成・配布できるGoに乗り換える方が楽だと考えています。
- 収集したデータをすぐに可視化したい【高速化・最適化】
- 現場にあるPC(OS不明)でも可視化したい【クロスプラットフォーム】
Webアプリを開発して、サーバーで処理するなら、クライアント(現場のPC)のリソースやOSに依存しないため、上記の要求を満たせると思います。
ただし、パフォーマンスを考慮すると、サーバーサイドの開発言語もPythonではなくGoを採用した方が良いかもしれません。
パフォーマンスだけでなく、学習コスト・チームの成熟度・納期なども考慮して、プログラミング言語を選定することが重要です
Goでデータ可視化するときにオススメのパッケージ
Pythonでデータ可視化するとき、以下のフローでコードを書く人が多いと思います。
- pandasで前処理(CSVファイルから任意データを抽出など)
- matplotlibでグラフ出力(散布図・ヒストグラムなどの作成と保存)
Goのpandasライクなパッケージは調査済みでしたが、matplotlibライクなパッケージについては調査中でした。

ダメ元で Twitter に疑問を投げたところ、gonum/plot を教えて頂きました。感謝!
なので本記事では、以下のフローでデータ可視化を行います。
- gotaで前処理
- gonum/plotでグラフ出力
実践 Gotaの基本的な使い方
まずはGotaの基本的な使い方を紹介します。
GotaでCSVファイルからデータフレーム生成
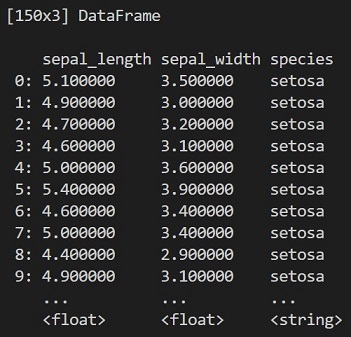
最初に iris.csv を読み込んで、データフレームを生成します。
|
1 2 3 4 5 6 7 8 9 10 11 |
// Read file f, err := os.Open("./files/iris.csv") if err != nil { log.Fatal(err) } defer f.Close() // File to Dataframe df := dataframe.ReadCSV(f) fmt.Println(df) fmt.Println(df.Describe()) |
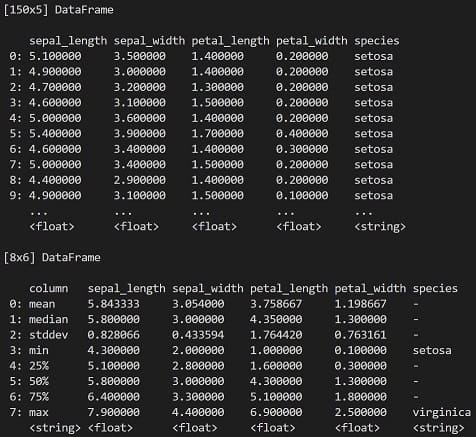
データフレームはターミナルに出力でき、Describe() で基本統計量の算出も簡単です。
Gotaでデータ抽出 -SelectとDrop-
カラム名を指定してデータを抽出するときは Select を使います。あるいは Drop を使って、不要なデータを排除することもできます。
|
1 2 3 4 5 |
// Select {"sepal_length", "sepal_width", "species"} DF := df.Select([]string{"sepal_length", "sepal_width", "species"}) // Drop {"petal_length", "petal_width"} DF := df.Drop([]string{"petal_length", "petal_width"}) |
カラム数に応じて、Select と Drop を使い分ければ良いです。
Gotaでフィルタ処理 -Filter-
Filter を使えば、任意の行を抽出できます。例えば、以下のコードで”virginica”に関するレコードのみを抽出できます。
|
1 2 3 4 5 6 7 |
DF := df.Filter( dataframe.F{ Colname: "species", Comparator: series.Eq, Comparando: "virginica", }, ) |
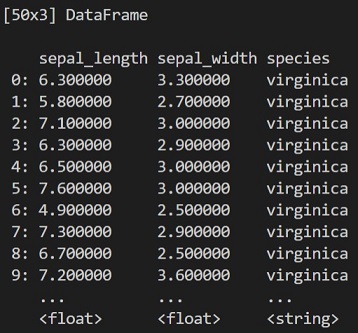
150行のデータから”virginica”に関する50行のデータのみを抽出できています。Gotaで他にも様々な処理ができますので、気になる人は調べてみてください。
実践 Gonum Plot の基本的な使い方
続いてGonum Plotの基本的な使い方を紹介します。
Gonum Plotでグラフ作成
Example plotsにグラフ作成のサンプルコード集があるので、それをベースに自作すれば良いです。
どのグラフを作成する場合でも、基本的には以下のコードが雛形になります。
|
1 2 3 4 5 6 7 8 9 10 11 12 13 14 15 16 17 18 19 20 21 22 23 24 25 26 27 28 |
func main() { // Make a scatter data from dataframe sData := makeScatterPlot(df) // Create a new plot p := plot.New() p.Title.Text = "Points Example" p.X.Label.Text = "X" p.Y.Label.Text = "Y" // Draw a grid behind the data p.Add(plotter.NewGrid()) // Make a scatter plotter s, err := plotter.NewScatter(sData) if err != nil { log.Fatal(err) } // Add the plotters to the plot, with a legend p.Add(s) p.Legend.Add("scatter", s) // Save the plot to a PNG file if err := p.Save(4*vg.Inch, 4*vg.Inch, "Example.png"); err != nil { log.Fatal(err) } } |
ソースコードp3のような「plotter用のデータを生成する関数」を自作する以外は雛形コードを使い回せばOKです。
実践 Gota と Gonum Plot でグラフ作成
最後に Gota と Gonum Plot を使ったグラフ作成を行います。
プロジェクトフォルダの構成
プロジェクトフォルダの構成は以下の通りです。
|
1 2 3 4 5 6 7 8 9 10 11 12 13 |
workspace └─docker-gonum-plot │──files │ └──iris.csv │──images │ │──Histogram.png │ └──ScatterPlot.png │──Dockerfile │──go.mod │──go.sum └──main.go |
filesフォルダの中身が対象データ(iris.csv)です。imagesフォルダがグラフの保存先です。
go.mod -バージョン管理-
go.mod は以下の通りです。
|
1 2 3 4 5 6 7 8 9 |
module example.com/myapp go 1.16 require ( github.com/go-gota/gota v0.11.0 gonum.org/v1/plot v0.9.0 ) |
main.go -データフレームからグラフを作成する-
今まで説明した内容を応用して作った main.go が以下です。
|
1 2 3 4 5 6 7 8 9 10 11 12 13 14 15 16 17 18 19 20 21 22 23 24 25 26 27 28 29 30 31 32 33 34 35 36 37 38 39 40 41 42 43 44 45 46 47 48 49 50 51 52 53 54 55 56 57 58 59 60 61 62 63 64 65 66 67 68 69 70 71 72 73 74 75 76 77 78 79 80 81 82 83 84 85 86 87 88 89 90 91 92 93 94 95 96 97 98 99 100 101 102 103 104 105 106 107 108 109 110 111 112 113 114 115 116 117 118 119 120 121 122 123 124 125 126 127 128 129 130 131 132 133 134 135 136 137 138 139 140 141 142 143 144 145 146 147 148 149 150 151 152 153 154 155 156 157 158 159 160 161 162 163 164 165 166 167 168 169 170 171 172 173 174 175 176 177 178 179 180 181 182 183 184 185 186 187 188 189 190 191 192 193 194 195 196 197 198 199 200 201 202 203 204 205 206 207 208 209 210 211 212 213 214 215 216 217 218 219 220 221 222 223 224 225 226 227 228 229 |
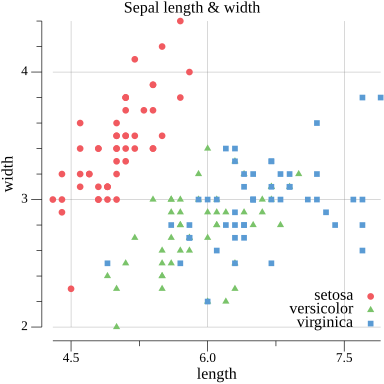
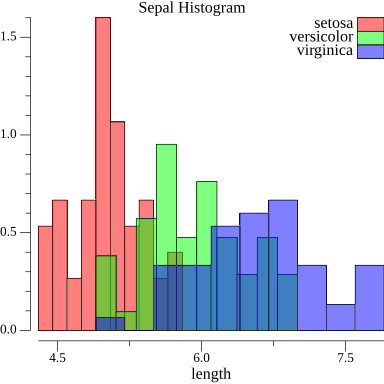
package main import ( "fmt" "os" "log" "strconv" "image/color" "github.com/go-gota/gota/dataframe" "github.com/go-gota/gota/series" "gonum.org/v1/plot" "gonum.org/v1/plot/plotter" "gonum.org/v1/plot/plotutil" "gonum.org/v1/plot/vg" "gonum.org/v1/plot/vg/draw" ) func Preprocess(df dataframe.DataFrame) dataframe.DataFrame{ // DF := df.Select([]string{"sepal_length", "sepal_width", "species"}) DF := df.Drop([]string{"petal_length", "petal_width"}) return DF } func SeparateData(df dataframe.DataFrame, specie string) dataframe.DataFrame { // Filter DF := df.Filter( dataframe.F{ Colname: "species", Comparator: series.Eq, Comparando: specie, // "setosa" }, ) return DF } func makeScatterPlot(df dataframe.DataFrame) *plotter.Scatter { records := df.Records() n := len(records) pts := make(plotter.XYs, n-1) for i, r := range records { if i == 0 { // Skip colname continue }else if i == n { // len(records) == n but len(pts) == n-1 break } // str to float64 pts[i-1].X, _ = strconv.ParseFloat(r[0], 64) pts[i-1].Y, _ = strconv.ParseFloat(r[1], 64) } // fmt.Println(pts) s, err := plotter.NewScatter(pts) if err != nil { log.Fatal(err) } return s } func makeHistValues(df dataframe.DataFrame, bin int) (*plotter.Histogram, *plotter.Histogram){ records := df.Records() n := len(records) ptv1 := make(plotter.Values, n-1) ptv2 := make(plotter.Values, n-1) for i, r := range records { if i == 0 { // Skip colname continue }else if i == n { // len(records) == n but len(pts) == n-1 break } // str to float64 ptv1[i-1], _ = strconv.ParseFloat(r[0], 64) ptv2[i-1], _ = strconv.ParseFloat(r[1], 64) } // fmt.Println(ptv1) // fmt.Println(ptv2) h1, err := plotter.NewHist(ptv1, bin) if err != nil { log.Fatal(err) } h2, err := plotter.NewHist(ptv2, bin) if err != nil { log.Fatal(err) } return h1, h2 } func SaveScatterPlot(df1, df2, df3 dataframe.DataFrame, species []string) { // Create a new plot p := plot.New() // Set its title and axis labels p.Title.Text = "Sepal length & width" p.X.Label.Text = "length" p.Y.Label.Text = "width" p.Add(plotter.NewGrid()) // Make a scatter plotter sp1 := makeScatterPlot(df1) sp2 := makeScatterPlot(df2) sp3 := makeScatterPlot(df3) // Set color with "gonum.org/v1/plot/plotutil" sp1.GlyphStyle.Color = plotutil.Color(0) sp2.GlyphStyle.Color = plotutil.Color(1) sp3.GlyphStyle.Color = plotutil.Color(2) // Set color with "image/color" // sp1.GlyphStyle.Color = color.RGBA{R: 128, G: 255, B: 255, A: 128} // sp2.GlyphStyle.Color = color.RGBA{R: 255, G: 128, B: 255, A: 128} // sp2.GlyphStyle.Color = color.RGBA{R: 255, G: 255, B: 128, A: 128} // Set shape sp1.Shape = &draw.CircleGlyph{} sp2.Shape = &draw.PyramidGlyph{} sp3.Shape = &draw.BoxGlyph{} // Add the plotters to the plot, with a legend p.Add(sp1) p.Add(sp2) p.Add(sp3) p.Legend.Add(species[0], sp1) p.Legend.Add(species[1], sp2) p.Legend.Add(species[2], sp3) // Set the range of the axis // p.X.Min = 3 // p.X.Max = 9 // p.Y.Min = 1 // p.Y.Max = 5 // Save the plot to a PNG file if err := p.Save(4*vg.Inch, 4*vg.Inch, "./images/ScatterPlot.png"); err != nil { log.Fatal(err) } } func SaveHistogram(df1, df2, df3 dataframe.DataFrame, species []string) { // Create a new plot p := plot.New() // Set its title and axis labels p.Title.Text = "Sepal Histogram" p.X.Label.Text = "length" // Make a histogram values bin := 10 histA, _ := makeHistValues(df1, bin) histB, _ := makeHistValues(df2, bin) histC, _ := makeHistValues(df3, bin) // Normalize histA.Normalize(1) histB.Normalize(1) histC.Normalize(1) // Set color with "gonum.org/v1/plot/plotutil" // histA.FillColor = plotutil.Color(0) // histB.FillColor = plotutil.Color(1) // histC.FillColor = plotutil.Color(2) // Set color with "image/color" histA.FillColor = color.RGBA{R: 128, G: 255, B: 255, A: 128} histB.FillColor = color.RGBA{R: 255, G: 128, B: 255, A: 128} histC.FillColor = color.RGBA{R: 255, G: 255, B: 128, A: 128} // Set line style histA.LineStyle.Width = vg.Length(0.5) histB.LineStyle.Width = vg.Length(0.5) histC.LineStyle.Width = vg.Length(0.5) // Add the plotters to the plot, with a legend p.Add(histA, histB, histC) p.Legend.Add(species[0], histA) p.Legend.Add(species[1], histB) p.Legend.Add(species[2], histC) p.Legend.Top = true // p.Legend.Left = true // Save the plot to a PNG file. if err := p.Save(4*vg.Inch, 4*vg.Inch, "./images/Histogram.png"); err != nil { log.Fatal(err) } } func main() { // Read file f, err := os.Open("./files/iris.csv") if err != nil { log.Fatal(err) } defer f.Close() // File to Dataframe df := dataframe.ReadCSV(f) fmt.Println(df) fmt.Println(df.Describe()) // Select {"sepal_length", "sepal_width", "species"} DF := Preprocess(df) fmt.Println(DF) // Separate data by species species := []string{"setosa", "versicolor", "virginica"} seDF := SeparateData(DF, species[0]) veDF := SeparateData(DF, species[1]) viDF := SeparateData(DF, species[2]) // fmt.Println(seDF) // fmt.Println(veDF) fmt.Println(viDF) // Save the plot to a PNG file SaveScatterPlot(seDF, veDF, viDF, species) SaveHistogram(seDF, veDF, viDF, species) } |
このコードを実行すると ScatterPlot.png と Histogram.png が生成されます。

まとめ
Go言語によるデータ可視化についてソースコード付きで紹介しました。
- なぜPythonではなくGoを使うのか?
- Gota と Gonum Plot の基本的な使い方
- 実践 Goでグラフ作成
「Goでグラフ作成したい人」や「Pythonユーザーだけど、Goにも手を出してみたい人」の参考になれば嬉しいです。
(Goらしいコードが書けてるか少し不安なので、優しく教えて頂けたら嬉しいです)
以下 Go言語の本紹介。最初の一冊は「みんなのGo言語」がオススメです。