こんにちは。
現役エンジニアの”はやぶさ”@Cpp_Learningです。仕事でもプライベートでも機械学習で色々やってます。
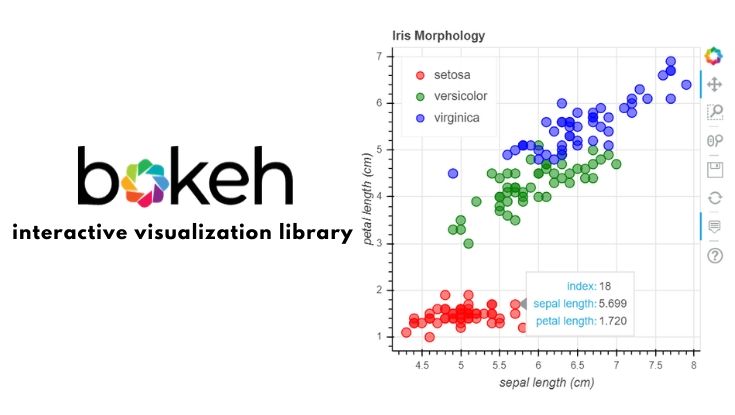
今回はBokehによるインタラクティブなデータ可視化について紹介します。
Contents
Bokehを使うモチベーション
データ分析するとき、可視化して”データをしっかり観察”することが重要です。
Pythonには matplotlib , seaborn などの優秀な可視化ライブラリがあります。ただ、以下のようなインタラクティブな可視化をしたいときもあります。
https://twitter.com/Cpp_Learning/status/1269454918307377152
Bokeh , Plotlyを使えば、上図のようなグラフ描画+マウス操作を実現できます。Bokehの方が比較的簡単だと思うので、本記事でBokehの基本的な使い方を紹介します。
実践!Bokehでインタラクティブなグラフ描画 -基礎編-
データ分析するとき、Jupyter Notebookを使う機会が多いので、今回はGoogle ColabでBokehによるインタラクティブなグラフ描画を実践します。
インストールとバージョン確認
最初に公式サイトに従いBokehをインストールします。Google Colabを使う場合は、インストール済みなので、何もしなくてOKです。
以下のコマンドでバージョン確認できます。
|
1 2 3 4 5 6 |
from IPython import __version__ as ipython_version from pandas import __version__ as pandas_version from bokeh import __version__ as bokeh_version print("IPython - %s" % ipython_version) print("Pandas - %s" % pandas_version) print("Bokeh - %s" % bokeh_version) |
IPython – 5.5.0
Pandas – 1.0.4
Bokeh – 1.4.0
上記のバージョンで動作確認しました。
Importと出力設定
まずはImportと出力設定から
|
1 2 3 4 5 6 7 |
import numpy as np from bokeh.io import output_notebook, show from bokeh.plotting import figure, ColumnDataSource, output_file, reset_output # 出力設定 # reset_output() output_notebook() |
Google Colab(Jupyter Notebook)を使う場合、reset_output()ではなくoutput_notebook()を使います。
Bokehで散布図を描画
以下がBokehによる基本的なグラフ描画のコードです。
|
1 2 3 4 5 6 7 8 9 10 11 12 13 14 15 16 17 18 19 20 21 22 23 24 25 26 27 28 |
# サンプルデータ x = np.array([1, 2, 3, 4, 5, 6, 7, 8, 9]) y = np.array([1.1, 1.9, 2.2, 4.2, 6.0, 7.5, 7.8, 8.4, 9.1]) # x = [1, 2, 3, 4, 5, 6, 7, 8, 9] # y = [1.1, 1.9, 2.2, 4.2, 6.0, 7.5, 7.8, 8.4, 9.1] # グラフ全体の設定 p = figure( title="simple example", # グラフのタイトル plot_width=400, # グラフの横幅 plot_height=400, # グラフの縦幅 x_axis_label='x', # x軸のラベル y_axis_label='y', # x軸のラベル # x_axis_type="log" # 軸タイプ ) # 散布図 p.circle( x, # x軸 y, # y軸 size=10, # プロットグラフに対しての直径値 line_color="navy", # 円の線の色 fill_color="blue", # 円の色 fill_alpha=0.5 # 円の透明度 ) # 描画 show(p) |
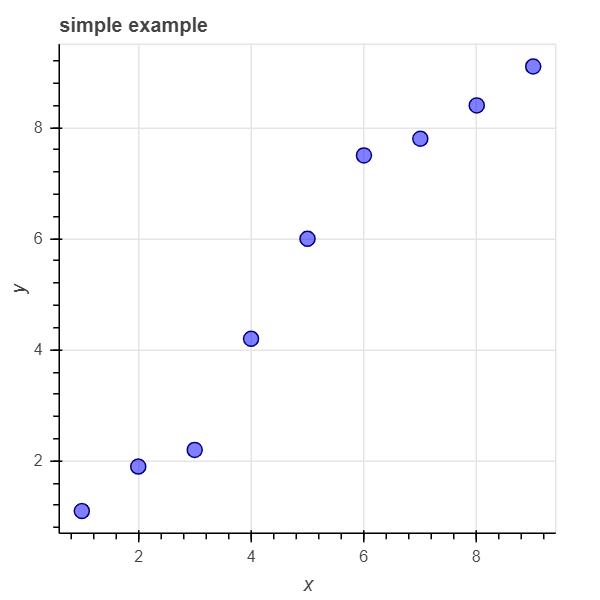
デフォルト設定でも良いのですが、上記コードの設定を使い回すことが多いです。
またpythonのリスト, numpy.arrayなどのフォーマット違いを意識せずに、ほぼ同じコードで描画できます。
- 自分好みの設定を使い回す
- pythonのリスト, numpy.array, pandas.DataFrameなどのフォーマット違いを吸収して描画できる
散布図と折れ線図を重ねて描画
複数グラフを重ねた描画もできます。例えば、散布図と折れ線図を重ねて描画してみます。
|
1 2 3 4 5 6 7 8 9 10 11 |
# 折れ線図 p.line(x, y, legend_label="Sample") # 散布図 p.circle(x, y, size=10, fill_alpha=0.5) # 凡例の位置設定 p.legend.location = "top_left" # 描画 show(p) |
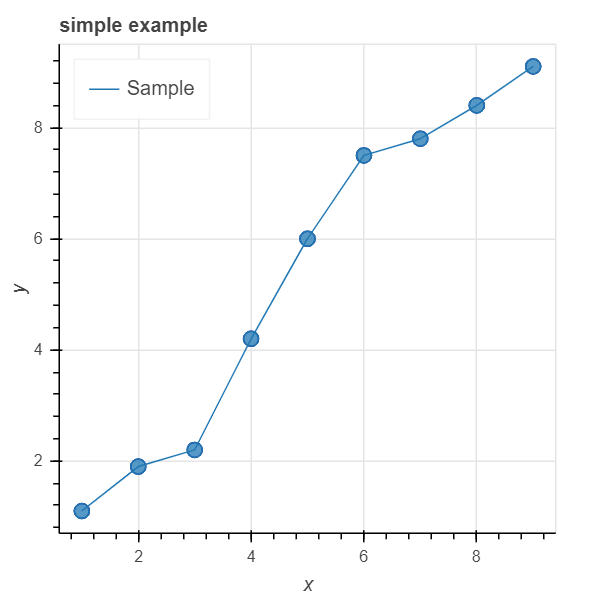
このような短いコードでインタラクティブなデータ可視化を実現できます。
Bokehでマウスオーバー
サクッと マウスオーバー がしたくてBokehを採用することも多いです。
|
1 2 3 4 5 6 7 8 9 10 11 12 13 14 15 16 17 18 19 20 21 22 23 24 25 26 27 28 29 |
# オリジナル辞書を定義 source = ColumnDataSource(data=dict( x=x, y=y, label=['A', 'B', 'B', 'B', 'A', 'B', 'A', 'B', 'A'], )) # tooltips設定 TOOLTIPS = [ ("index", "$index"), ("(x,y)", "($x, $y)"), ("label", "@label"), ] # グラフ全体の設定 p = figure( title="Mouse over the dots", plot_width=400, plot_height=400, x_axis_label='x', y_axis_label='y', tooltips=TOOLTIPS ) # 辞書を活用 p.circle('x', 'y', size=10, fill_alpha=0.5, source=source) # 描画 show(p) |
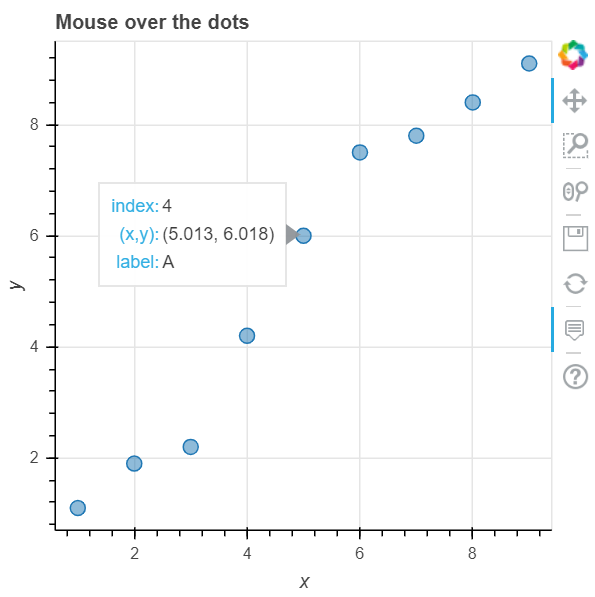
tooltips により、マウスで選択したプロット情報を表示できます。またオリジナルの辞書を定義し、tooltipsに@hoge(この例では@label)を組み込むこともできます。
- マウスオーバーを簡単に実現できる
- 表示するプロット情報をカスタムできる
実践!Bokehでインタラクティブなグラフ描画 -応用編-
Bokehの基本的な使い方が分かったので、今度はpandasと連携してインタラクティブなデータ可視化を実践します。
Importと出力設定
まずはImportと出力設定から。基礎編との違いは irisデータセット に関するコードの有無です。
|
1 2 3 4 5 6 7 8 9 |
from bokeh.plotting import figure, output_file, show, ColumnDataSource from bokeh.sampledata.iris import flowers from bokeh.io import output_notebook # 出力設定 output_notebook() # irisデータセット flowers.head() |
pandas.DataFrameをインタラクティブに可視化❶
基礎編で学んだ通り、pandas.DataFrameでもインタラクティブな可視化ができます。
|
1 2 3 4 5 6 7 8 9 10 11 12 13 14 15 16 17 18 19 20 21 22 23 24 25 26 27 28 29 30 31 |
# 辞書 source = ColumnDataSource(data=dict( x=flowers["sepal_length"], y=flowers["petal_length"], species=flowers["species"], )) # tooltips設定 TOOLTIPS = [ ("index", "$index"), ("sepal_length", "$x"), ("petal_length", "$y"), ("label", "@species"), ] # グラフ全体の設定 p = figure( title="Iris Morphology", plot_width=400, plot_height=400, x_axis_label='sepal length', y_axis_label='petal length', tooltips=TOOLTIPS ) # 描画 p.circle('x', 'y', fill_alpha=0.5, size=10, source=source) # 出力 output_file("iris.html") show(p) |
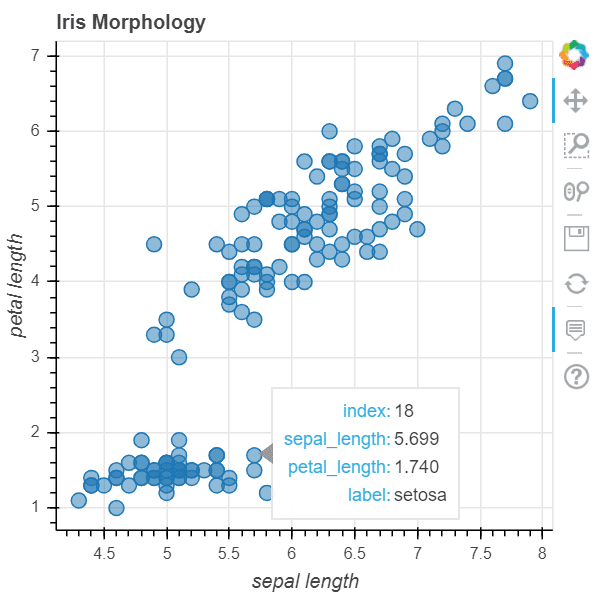
簡単ですね。
pandas.DataFrameをインタラクティブに可視化❷
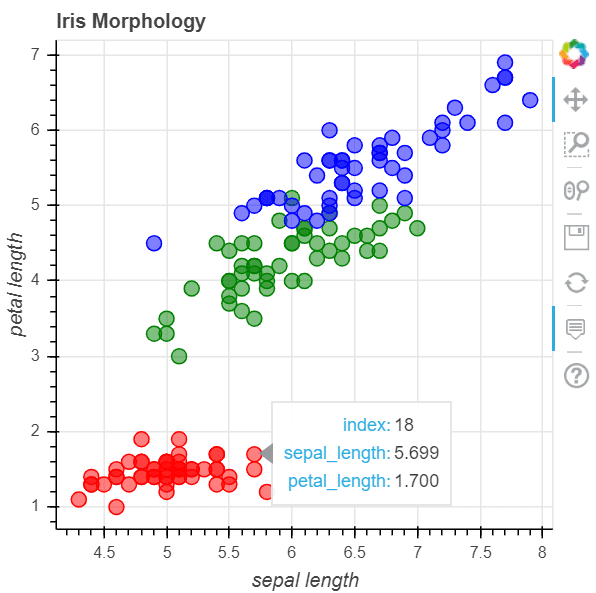
マウスオーバーでラベルを表示するより、各プロットを色付けした方が直観的で良い気がします。
|
1 2 3 4 5 6 7 8 9 10 11 12 13 14 15 16 17 18 19 20 21 22 23 24 25 26 27 28 29 30 31 32 |
# tooltips設定 TOOLTIPS = [ ("index", "$index"), ("sepal_length", "$x"), ("petal_length", "$y") ] # グラフ全体の設定 p = figure( title="Iris Morphology", plot_width=400, plot_height=400, x_axis_label='sepal length', y_axis_label='petal length', tooltips=TOOLTIPS ) # 色設定 colormap = {'setosa': 'red', 'versicolor': 'green', 'virginica': 'blue'} colors = [colormap[x] for x in flowers['species']] # 描画 p.circle( flowers["sepal_length"], flowers["petal_length"], color=colors, fill_alpha=0.5, size=10, ) # 出力 output_file("iris.html") show(p) |
pandas.DataFrameをインタラクティブに可視化➌
凡例があるとより親切かも
|
1 2 3 4 5 6 7 8 9 10 11 12 13 14 15 16 17 18 19 20 21 22 23 24 25 26 27 28 29 30 |
# ラベル別のデータフレーム作成 df_se = flowers[flowers['species'] == 'setosa'] df_ve = flowers[flowers['species'] == 'versicolor'] df_vi = flowers[flowers['species'] == 'virginica'] # tooltips設定 TOOLTIPS = [ ("index", "$index"), ("sepal length", "$x"), ("petal length", "$y"), ] # グラフ全体の設定 p = figure( title="Iris Morphology", plot_width=400, plot_height=400, x_axis_label='sepal length (cm)', y_axis_label='petal length (cm)', tooltips=TOOLTIPS ) p.circle(df_se["sepal_length"], df_se["petal_length"], size=10, fill_alpha=0.5, color="red", legend_label="setosa") p.circle(df_ve["sepal_length"], df_ve["petal_length"], size=10, fill_alpha=0.5, color="green", legend_label="versicolor") p.circle(df_vi["sepal_length"], df_vi["petal_length"], size=10, fill_alpha=0.5, color="blue", legend_label="virginica") p.legend.location = "top_left" # 出力 output_file("bokeh-iris.html") show(p) |
Bokehの描画したグラフはhtmlファイルで出力できるので、pythonコードの提供や環境構築不要でインタラクティブなグラフを共有できます。
今回作成したグラフ(bokeh-iris.html)を公開するので、自由に触ってみて下さい(*・ω・)ノ♪
まとめ
インタラクティブなデータ可視化ライブラリ Bokeh の基本的な使い方を紹介しました。
Pythonには matplotlib , seaborn などの優秀な可視化ライブラリがありますが、グラフをマウス操作したときは Bokeh がオススメです。
htmlファイルでインタラクティブなグラフを共有できるのも嬉しいですね(*・ω・)ノ♪
本記事が何かの参考になれば嬉しいです。
以下 データ分析に関する良書の紹介

